
BAM 15 – A new way to decrease body fat?
Novaglo Research 1 Oct 2025
Obesity is a health problem affecting more than 40% of US adults and 13% of the global population. Anti-obesity treatments including diet, exercise, surgery and pharmacotherapies have so far failed to reverse obesity incidence. Herein, we target obesity with a pharmacotherapeutic approach that decreases caloric efficiency by mitochondrial uncoupling. We show that a recently identified mitochondrial uncoupler BAM15 is orally bioavailable, increases nutrient oxidation, and decreases body fat mass without altering food intake, lean body mass, body temperature, or biochemical and haematological markers of toxicity. BAM15 decreases hepatic fat, decreases inflammatory lipids, and has strong antioxidant effects. Hyperinsulinemic-euglycemic clamp studies show that BAM15 improves insulin sensitivity in multiple tissue types. Collectively, these data demonstrate that pharmacologic mitochondrial uncoupling with BAM15 has powerful anti-obesity and insulin sensitizing effects without compromising lean mass or affecting food intake. Read the Full article here: https://rdcu.be/eKDF6
Obesity is associated with shortened lifespan and contributes to complications including infertility, mental health problems and metabolic diseases including cardiovascular diseases, fatty liver disease, and at least 13 types of cancer1,2,3,4,5,6. Identification of drugs that safely reverse obesity could increase healthspan and improve quality of life on a global scale.
Exercise and calorie restriction are effective anti-obesity interventions, but few patients adhere to the life-long diet and exercise programs required7,8,9. For example, one population-based cohort study of ~300,000 participants over a 9-year period found that the probability of an obese person, with a body mass index (BMI > 30), attaining a normal weight (BMI < 25) was <1%, while for morbidly obese individuals (BMI > 40) this incidence decreased to ~0.1%10. Bariatric surgery is the most effective anti-obesity intervention11,12 but it is not a viable global solution due to the cost and risks involved13,14. There is clear need for pharmacological weight-loss assistance that can be used alone or as an adjunct to lifestyle modification.
There are several FDA-approved anti-obesity drugs that primarily target food intake or nutrient absorption, but most have unwanted on- and off-target adverse effects that prevent their mainstream adoption; reviewed in Manning et al.15 and Dietrich and Horvath16. An alternative approach to decreasing food intake or absorption is to decrease the metabolic efficiency whereby food is converted into useful energy17,18,19. Small molecule mitochondrial protonophore uncouplers decrease mitochondrial coupling efficiency resulting in increased nutrient oxidation to produce a given amount of ATP17. The mitochondrial uncoupler 2,4-dinitrophenol (DNP) shows proof-of-principle that mitochondrial protonophores have weight-loss effects in humans as ~90% of patients taking 300 mg DNP per day (3 mg/kg for a 100 kg person) lost 2–3 pounds per week without changes in food intake20,21. However, DNP has a narrow window between effective and toxic doses22,23 and it was banned for human use by the FDA in 1938. To overcome the narrow therapeutic window of DNP, researchers have developed less-toxic derivatives that are targeted to mitochondria, targeted to the liver, or formulated DNP for controlled-release. Targeting DNP to mitochondria by attaching lipophilic cations was ineffective because DNP could not recycle across the mitochondrial inner membrane24; however, liver-targeted DNP prodrugs and controlled-release formulations resulted in considerably improved safety and beneficial effects on insulin sensitivity and fatty liver disease25,26. Unfortunately, these approaches to control DNP toxicity resulted in the loss of anti-obesity effects. In fact, DNP is not well tolerated in mice and doses up to 89 mg/kg/d administered in drinking water did not result in weight loss in mice housed at room temperature27.
More than a dozen classes of molecules have mitochondrial protonophore activity, but molecules with activity specific to mitochondria are rare and only a few have anti-obesity efficacy with a suitable therapeutic window, reviewed in refs.28,29. In this study, we investigate the anti-obesity potential of BAM15 (N5,N6-bis(2-Fluorophenyl)[1,2,5]oxadiazolo[3,4-b]pyrazine-5,6-diamine), a recently-identified mitochondrial protonophore uncoupler that is structurally unrelated to DNP. We have previously validated BAM15 as a lipophilic weak acid mitochondrial protonophore, demonstrated that it can drive maximal mitochondrial respiration in vitro over a broad dosing range without causing respiratory collapse, and showed that intraperitoneal injection of BAM15 protected mice from acute kidney injury caused by ischemia–reperfusion30,31.
Herein we show that BAM15 is orally bioavailable, dose-dependently increases nutrient oxidation, and decreases body fat mass without altering food intake or decreasing lean body mass in mice fed an obesigenic western diet (WD). We show that BAM15 decreases insulin resistance in multiple tissue types and has beneficial effects on liver fat, oxidative stress, and inflammation. These phenotypes occur with no observed adverse effects detected in body temperature or key clinical biochemistry and haematology parameters.
BAM15 properties and biological activity
We first compared BAM15 (Fig. 1a) to the prototype mitochondrial uncoupler DNP using a Seahorse XF Analyser to assess drug-induced oxygen consumption rate. Normal murine liver (NMuLi) cells were treated with BAM15 or DNP at doses ranging from 0.1 to 100 μM (Fig. 1b). This experiment showed that BAM15 was ~7-fold more potent than DNP for stimulating oxygen consumption rate (OCR) (average EC50 values of 1.4 μM for BAM15 vs. 10.1 μM for DNP) and was capable of sustaining high levels of mitochondrial respiration across a broad concentration range from 3 to 100 µM (Fig. 1b). However, the dosing window where DNP stimulated maximal respiration was much smaller than for BAM15 and dose escalation of DNP above 30 µM resulted in respiratory inhibition (Fig. 1b). A similar dose response relationship was observed for each uncoupler on extracellular acidification rate (Supplementary Fig. 1).

a Chemical structure of BAM15. b Oxygen consumption rate (OCR) of normal mouse liver cells (NMuLi) treated with BAM15 (black triangles) or DNP (orange squares), measured by Seahorse XF assay, n = 3 biologically independent experiments. c Pharmacokinetics of BAM15 administered by i.v. injection at 1 mg/kg (n = 4 animals) and oral gavage at 10 mg/kg (n = 3 animals). d Tissue distribution and (e) plasma partition coefficient (Kp) of BAM15 administered by oral gavage at 50 mg/kg, n = 6 animals for liver, quad and serum examined over two independent experiments, n = 3 animals used for brain, heart, kidney, WAT measurements, (n = 2 for brain 0.5 h timepoint only). f Body temperature measured over a 4 h period following oral gavage with vehicle or BAM15 at indicated doses. Significance tested with two-tailed Student’s t test comparing treatment to vehicle control at each timepoint, n = 6 animals. g, h Whole-body oxygen consumption rate measured in mice administered vehicle or BAM15 by oral gavage at indicated doses. Changes in oxygen consumption rate were quantified as delta VO2 from baseline for the periods 0–1, 1–2 and 2–3 h after oral gavage. n = 3 animals for 10 mg/kg, 50 mg/kg and n = 4 animals for vehicle and 100 mg/kg. Asterisk (*) indicates p < 0.004 by one-way ANOVA. i Tissue specific oxygen consumption measured by OROBOROS assay, 1 h post-oral gavage of 50 mg/kg BAM15 or vehicle control, n = 3 animals, asterisk (*) indicates p = 0.001 by two-way ANOVA. All data presented as mean values ± SEM. (f–i) Colour scale: grey—vehicle, pale blue—10 mg/kg, light blue—50 mg/kg, electric blue—100 mg/kg, navy blue—150 mg/kg, dark purple—200 mg/kg.
We next assessed oral bioavailability of BAM15 in mice by comparing pharmacokinetics when delivered per oral (p.o.) or by intravenous (i.v.) tail vein injection. A dose-normalized area under the curve calculation showed that BAM15 was 67% orally bioavailable and p.o. delivery resulted in an average maximum plasma concentration (Cmax) of 8.2 µM with a 1.7 h half-life (t1/2) in C57BL/6J mice (Fig. 1c). BAM15 tissue distribution was determined by orally administering BAM15 (50 mg/kg) and euthanizing mice at times 0.5, 1, 2, and 4 h. BAM15 measurement in tissue extracts revealed primary distribution to the liver with gradual clearance from tissues over 4 h (Fig. 1d, e).
To determine the maximum range for acute dosing of BAM15 we assessed core body temperature using a rectal probe thermometer and measured key biochemical and haematological indicators of toxicity. We found that BAM15 dosing was limited by solubility in methylcellulose such that preparations for 100 mg/kg resulted in a fine suspension, while more concentrated solutions of 150 and 200 mg/kg resulted in a thickening paste. Nevertheless, doses up to 200 mg/kg had no effect on body temperature (Fig. 1f). Dosing was not escalated beyond 200 mg/kg because it became impractical to solubilize BAM15 for p.o. delivery and transient behavioural signs of lethargy were observed that were not possible to distinguish drug effects from delivery of paste to the stomach. DNP was highly soluble but resulted in a no observed adverse effect level of 25 mg/kg (Supplementary Fig. 2).
We next examined the pharmacodynamic effect of BAM15 by assessing oxygen consumption using an Oxymax CLAMS indirect calorimeter. Mice were orally administered BAM15 at doses of 10, 50, or 100 mg/kg, or vehicle control. The vehicle and 10 mg/kg BAM15 dose had no detectable impact on OCR while the 50 and 100 mg/kg doses of BAM15 increased oxygen utilisation in the first hour following gavage by 30% (p = 0.050, compared with vehicle control) and by 50% over baseline (p < 0.001, compared with vehicle control), respectively. In mice administered 100 mg/kg BAM15, increased OCR was sustained in the period 1–2 h post gavage by 48% over baseline (p = 0.004, compared with vehicle control), then gradually returned to baseline ~3 h post gavage (Fig. 1g, h), which is consistent with the pharmacokinetic profile (Fig. 1c).
To better understand which tissues were contributing to increased energy expenditure, we treated mice with 50 mg/kg BAM15 for 1 h and analysed OCR in homogenates from key metabolic tissues including liver, muscle, white fat and brown fat. Liver tissue from BAM15-treated mice had a 54% increase in respiration rate compared to the vehicle control, while muscle showed a non-significant trend for increased respiration and adipose tissue depot respiration was unchanged (Fig. 1i).
BAM15 fed in Western diet increases energy expenditure
BAM15 has low aqueous solubility and a half-life of 1.7 h; therefore, it was admixed in food for long-term treatment studies. A physiologically relevant high-fat (45% by kCal) high-sucrose (16% by kCal) WD was prepared with or without 0.1% w/w BAM15 (WD + BAM15). Mice were monitored for food intake and BAM15 exposure overnight. The 0.1% w/w BAM15 dose resulted in plasma concentrations between 5 and 10 µM for the entire dark period (7 p.m.–7 a.m.) (Fig. 2a), with the actual dose of BAM15 (Fig. 2b) calculated from food intake (Fig. 2c). We next assessed energy expenditure in mice fed WD + BAM15 compared with mice fed WD control (without BAM15) by indirect calorimetry. Relative to WD controls, mice fed 0.1% BAM15 in WD had an average 15% increase in oxygen consumption during the dark period (p < 0.001, Fig. 2d, g). The increased rate of energy expenditure correlated with drug exposure in the dark period and was not caused by changes in locomotor activity (Fig. 2e, h). The average respiratory exchange ratio (VCO2/VO2) was lower during the dark period in WD + BAM15 fed mice than controls (WD 0.86 ± 0.011 vs. WD + BAM15 0.82 ± 0.004, p = 0.010), indicating that BAM15 increased fat oxidation (Fig. 2f, i).
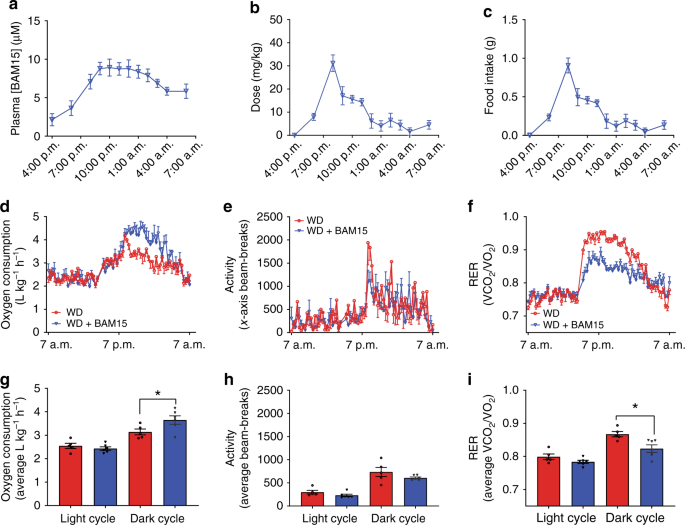
a Plasma drug exposure for mice fed WD containing 0.1% BAM15 (WD + BAM15) was measured overnight. b Dose of BAM15 calculated from (c) food intake, recorded overnight. d BAM15 feeding increased oxygen consumption rate by an average of 15% over the dark cycle, without altering (e) locomotor activity. f Mice fed WD + BAM15 had lower respiratory exchange ratios (RER) during the dark cycle. Average (g) oxygen consumption, (h) locomotor activity and (i) RER were used to calculate significant difference between treatment groups within each cycle, determined by two-tailed unpaired t test with Welch’s correction, asterisk (*) indicates p < 0.05, exact p values—(g) p = 0.0469, (i) p = 0.0128. n = 5 WD treated animals, n = 6 WD + BAM15-treated animals for all data. All data presented as mean values ± SEM. Colour scale: red—Western diet (WD), blue—Western diet + BAM15 (WD + BAM15). Source data are provided in Source data file.
BAM15 prevents diet-induced fat gain and glucose intolerance
BAM15 admixed in WD at 0.1% w/w resulted in a drug exposure profile with desired bioactive effects observed for OCR and respiratory exchange ratio. Therefore, we next investigated the anti-obesity efficacy of BAM15. Male C57BL/6J mice were single housed to enable accurate food intake measurements and prevent variability related to fighting or huddling. Mice were fed WD or WD + BAM15 at 0.05%, 0.10%, and 0.15% w/w for 8 days. A separate group of age-matched chow-fed mice were used as controls for normal physiology. Body composition measured by serial EchoMRI every second day showed that BAM15 had a dose-dependent effect on fat mass such that 0.05% w/w BAM15 in WD prevented more than 50% of fat mass gain, while doses of 0.10–0.15% w/w BAM15 in WD completely prevented fat mass gain (Fig. 3a) without affecting fat-free lean mass or food intake (Fig. 3b, c). EchoMRI results were validated by daily body mass measurements (Fig. 3d) and dissection of four fat pad depots following euthanasia (Fig. 3e). Intraperitoneal glucose tolerance tests (i.p. GTT) were performed prior to treatment and on treatment day 7 (Fig. 3f). WD feeding for 7 days induced glucose intolerance in control mice while all three groups of mice fed BAM15 were protected from WD-induced glucose intolerance (Fig. 3f, g). The BAM15-induced improvements in glucose tolerance, compared with WD control mice, were associated with a dose-dependent decrease in fasting blood glucose (Fig. 3h) and decreased random-fed serum insulin levels (Fig. 3i). These data suggest that BAM15-induced improvements in glucose tolerance are likely related to improved insulin sensitivity.
Fig. 3: BAM15 prevents diet-induced fat gain and glucose intolerance.
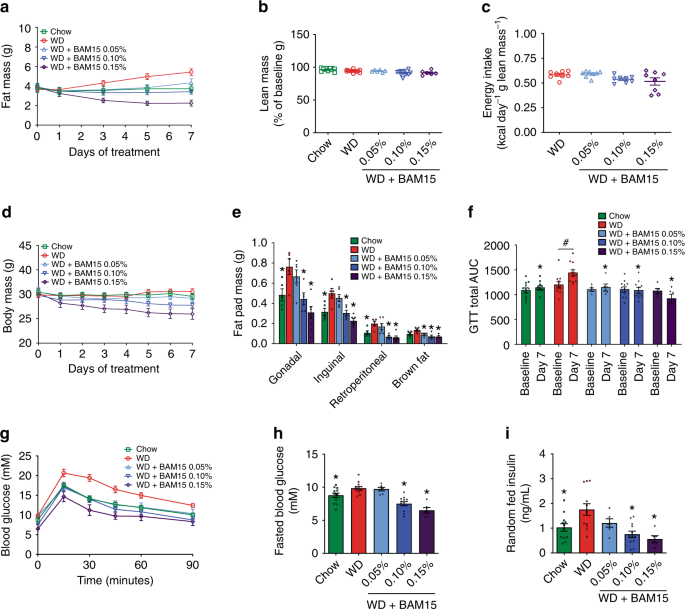
a–d Mice fed a chow diet or WD ± BAM15 at doses of 0.05, 0.10, and 0.15% were evaluated for changes in fat mass, lean mass, and food intake and body weight. n = 12 animals for Chow, WD, WD + BAM15 0.10%, data obtained from three independent studies, n = 6 animals for WD + BAM15 0.05% and WD + BAM15 0.15% data from one study. e Average fat pad masses dissected from mice after 8 days of treatment. n = 6 animals for all treatment groups, data from one study. Significance determined by one-way ANOVA, where asterisk (*) indicates p < 0.05 compared with WD. Exact p values as follows—Gonadal: Chow, p = 0.0321; WD + BAM15 0.10%, p = 0.0124; WD + BAM15 0.15%, p = 0.0003. Inguinal: Chow, p = 0.0133; WD + BAM15 0.10%, p = 0.008; WD + BAM15 0.15%, p = 0.0002. Retroperitoneal: Chow, p = 0.036; WD + BAM15 0.10%, p = 0.0019; WD + BAM15 0.15%, p = 0.0006. Brown fat: WD + BAM15 0.05%, p = 0.0199; WD + BAM15 0.10%, p = 0.0017; WD + BAM15 0.15%, p = 0.0008. f–i n = 12 animals for Chow, WD, WD + BAM15 0.10%, data obtained from three independent studies, n = 6 animals for WD + BAM15 0.05% and WD + BAM15 0.15% data from one study. f Intraperitoneal glucose tolerance test (i.p. GTT) at baseline (day 0) and day 7 of treatment. Asterisk (*) indicates p < 0.05 compared with WD on day 7, determined by mixed-model analysis. Exact p values as follows—WD + BAM15 0.05%, p = 0.0021; Chow and WD + BAM15 0.10% and WD + BAM15 0.15% p < 0.0001. Hash (#) indicates p = 0.0046 comparing baseline to final AUC by paired two-tailed Student’s t test. g Day 7 i.p.GTT curves. h Fasting glucose level recorded after a 5 h fast. Asterisk (*) indicates p < 0.05 compared with WD by one-way ANOVA. Exact p values—Chow, p = 0.046; WD + BAM15 0.10% and WD + BAM15 0.15%, p < 0.0001. i Serum insulin measured on treatment day 8. Asterisk (*) indicates p < 0.05 compared with WD by one-way ANOVA. Exact p values—Chow, p = 0.0112; WD + BAM15 0.10%, p = 0.0003; WD + BAM15 0.15%, p = 0.0005. All data presented as mean values ± SEM. Colour scale: green—Chow, red—Western diet (WD), light blue—WD + BAM15 0.05%, electric blue—WD + BAM15 0.10%, dark purple—WD + BAM15 0.15%. Source data provided in Source data file.
BAM15 reverses diet-induced adiposity
We next investigated whether BAM15 could reverse obesity and obesity-related metabolic disorders. Mice were fed WD for 4 weeks, which increased their body mass by >20% and increased fat mass by threefold relative to their pre-diet starting point (Fig. 4a, b, diet conditioning period). Mice were then single housed, stratified, and randomized to treatment groups of WD or WD containing 0.1% BAM15 w/w for a further 5 weeks. The 0.1% w/w concentration of BAM15 was chosen as it completely prevented diet-induced fat gain, had no effect on food intake, resulted in an average overnight drug exposure of 5–10 µM, and had beneficial metabolic effects in the obesity prevention study without affecting fat-free mass (Fig. 3). An age-matched chow-fed control group was used to benchmark normal physiologic phenotypes (Chow). At the end of the 9-week study the BAM15-treated group consumed the same calories as WD control mice but had 15% less body weight that consisted almost entirely of less fat mass with no difference in fat-free lean mass (Fig. 4a–d). Faecal triglyceride, NEFA and cholesterol content were not statistically different between the WD or WD + BAM15 fed groups (Fig. 4e–g) demonstrating that fat loss was not due to lipid malabsorption. BAM15 treatment significantly decreased fat pad masses (Fig. 4h), demonstrating that BAM15 treatment reversed diet-induced obesity.
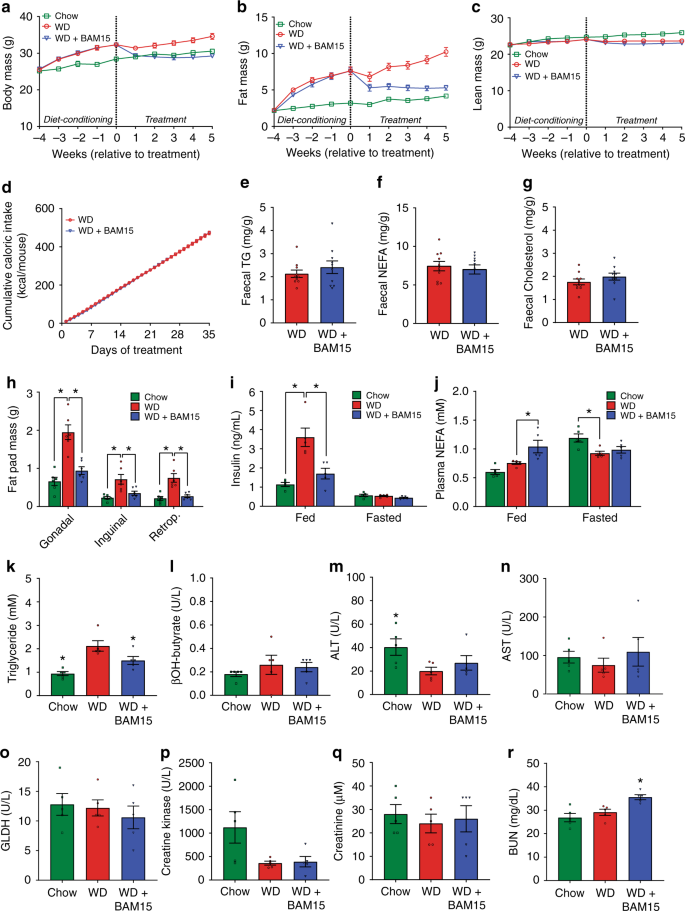
a–d Body mass, fat mass, lean mass, and cumulative food intake were recorded over the course of the study, n = 21 animals from four independent studies (except Week 1 fat mass and lean mass, n = 17 animals from three independent studies). e–g Fecal triglyceride, NEFA, and cholesterol levels comparing WD to WD + BAM15, n = 10 animals from two independent studies. Significance tested by two-tailed Student’s t test. h Final fad pad masses, n = 6 animals from one study. Asterisk (*) indicates p < 0.05 for each fat pad compared with WD, determined by one-way ANOVA. Exact p values as follows—Gonadal: Chow, p < 0.0001; WD + BAM15, p = 0.0003. Inguinal: Chow, p = 0.0015; WD + BAM15, p = 0.0125. Retroperitoneal: Chow, p = 0.0002; WD + BAM15, p = 0.0007. i, j Fed and 12 h fasted plasma insulin and NEFA concentrations, n = 5 animals from one study. Asterisk (*) indicates p < 0.05 for each treatment compared with WD, determined by two-way ANOVA. Exact p values as follows—Fed insulin; Chow and WD + BAM15, p < 0.0001. Fed NEFA; WD + BAM15, p = 0.0066. Fasted NEFA; Chow, p = 0.0118. Terminal plasma (k) triglyceride, (l) β-hydroxybutyrate, (m) ALT, (n) AST, (o) GLDH, (p) creatine kinase, (q) creatinine, and (r) BUN n = 5 animals from one study. Significance determined by one-way ANOVA, Asterisk (*) indicates p < 0.05 compared to WD. Exact p values as follows—Triglyceride: Chow, p = 0.0006; WD + BAM15, p = 0.0417. ALT: Chow, p = 0.0483. BUN: WD + BAM15, p = 0.0140. All data presented as mean values ± SEM. Colour scale: green—Chow, red—Western diet (WD), electric blue—WD + BAM15 0.10%. Source data provided in Source data file.
At the mid-point of treatment (~2.5 weeks, days 18–19), insulin levels in WD + BAM15-fed animals were twofold less than WD controls and not statistically different from chow-fed mice (Fig. 4i). Plasma NEFA levels of BAM15-treated animals in the fed state were elevated by 40%, which is in the normal physiologic range observed during fasting (Fig. 4j).
Plasma biochemical and haematological parameters were assessed from blood collected at euthanasia (Supplementary Table 1 with key markers shown in Fig. 4k–r). Plasma triglyceride levels of mice fed WD + BAM15 were decreased by 29% compared with WD control mice (Fig. 4k). Despite increased fat oxidation, BAM15 treatment did not induce ketosis as β-hydroxybutyrate levels were similar to WD control mice (Fig. 4l). Indicators of liver, muscle, and heart tissue health including ALT, AST, GLDH, and creatine kinase were not affected by BAM15 treatment (Fig. 4m–p). Plasma creatinine and blood urea nitrogen (BUN) are typical measures of renal health but can also indicate alterations in protein metabolism. Compared with the WD controls, BAM15-treated mice had normal creatinine levels and mildly (22%) elevated BUN levels that remained within the normal reference range for male C57BL/6 J mice32 (Fig. 4q, r).
BAM15 treatment improves liver antioxidant profile
BAM15 is primarily distributed to the liver; therefore, we investigated the effect of BAM15 on global metabolite changes in liver tissue following 20 days of treatment with 0.1% w/w BAM15 in WD. Compared to WD controls, 3% of liver metabolites (22 of 770 with a p value < 0.05) in WD + BAM15-fed animals were altered by more than twofold, and 0.1% of metabolites (1 of 770 with p < 0.05) were altered by more than fourfold (Supplementary Dataset 1). The metabolic pathways that were most altered are illustrated in Fig. 5a. Gamma-glutamylcysteine (GGC) was the metabolite with greatest statistically significant fold change (4.6-fold, p = 0.001). GGC is an important metabolic substrate for glutathione synthesis and antioxidant defence. Consistent with high levels of GGC, reduced glutathione (GSH) was increased 2.3-fold (p = 0.01) while oxidized glutathione concentrations (GSSG) were unaffected. Consistent with peptide antioxidant changes, the oxidised fatty acid 4-hydroxynonenal was also decreased by 49% (p = 0.002, Fig. 5b) in WD + BAM15-fed liver. The antioxidant profile of WD + BAM15 liver tissue was associated with lower levels of several bioactive pro-inflammatory eicosanoids and docosanoids (Fig. 5b). Together, these data indicate an antioxidant and anti-inflammatory phenotype in liver tissue of BAM15-treated mice.
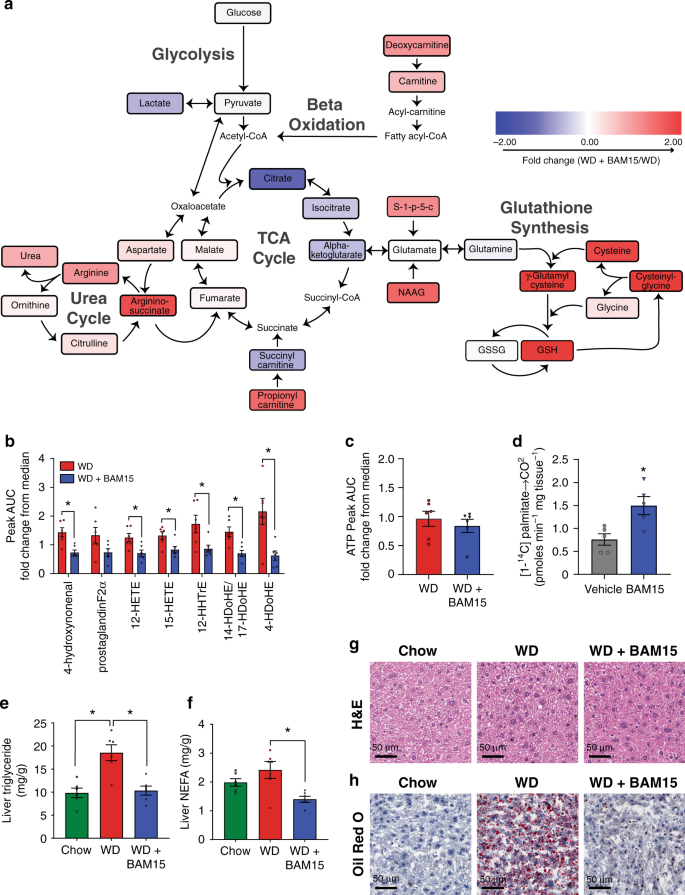
Metabolomics analysis was performed on liver tissue. a Schematic showing key energy production pathways. Metabolites colour-coded by fold change of WD + BAM15 compared with WD, scale of twofold positive (red) to twofold negative (blue). b bioactive lipids and (c) ATP presented as fold change from median AUC for each metabolite (where median rescaled to equal 1), n = 6 animals from one study. Significance determined by two-tailed Student’s t test, asterisk (*) indicates p < 0.05, exact p values as follows; 4-hydroxynonenal, p = 0.0029, 12-HETE, p = 0.0138, 15-HETE, p = 0.0177, 12-HHTrE, p = 0.0256, 14-HDoHE/17-HDoHE, p = 0.0036, 4-HDoHE, p = 0.0097. d Complete fatty acid ([1-14C] palmitate) oxidation was measured in liver tissue collected 1 h post-oral gavage of BAM15 (100 mg/kg) or vehicle control, n = 5 animals form one study. Asterisk (*) indicates p < 0.05 determined by two-tailed Student’s t test, p = 0.0042. Liver tissue was analyzed for (e) triglyceride and (f) NEFA levels, asterisk (*) indicates p < 0.05 compared with WD by one-way ANOVA exact p values as follows—Liver triglyceride: Chow, p = 0.0005; WD + BAM15, p = 0.009. Liver NEFA; WD + BAM15, p = 0.0042. The same liver tissue was fixed and stained with (g) H&E and (h) Oil Red O, representative images shown, scale bar 50 µm. All data presented as mean values ± SEM. Colour scale: green—Chow, red—Western diet (WD), electric blue—BAM15 (WD + BAM15 0.10% or BAM15 100 mg/kg), grey—vehicle. Source data provided in Source data file.
After 6 weeks of BAM15 treatment, insulin sensitivity was assessed by hyperinsulinemic-euglycemic clamp to determine which tissues contributed to the improved metabolic phenotype. The clamp data showed that BAM15 treatment markedly improved whole-body glucose clearance compared with WD control animals by increasing the glucose infusion rate required to maintain euglycemia to levels comparable with chow-fed mice (Fig. 6g and Supplementary Table 4). Insulin treatment in the clamped state partially suppressed hepatic glucose output in WD control mice and fully suppressed hepatic glucose output in chow-fed mice, while BAM15-treated animals had an intermediate phenotype that was not statistically different from either group (Fig. 6h). Mice fed WD + BAM15 had greater insulin-mediated suppression of adipose-derived NEFA production than WD controls (Fig. 6i). Compared with WD control mice, WD + BAM15-fed mice had greater [14C]2-deoxy-D-glucose uptake in mixed fibre type skeletal muscle (e.g. gastrocnemius and quadriceps) and epididymal adipose tissue (Fig. 6j, k). BAM15 treatment had no effect on heart glucose uptake (Fig. 6l).